5. Dashboard
The dashboard enables you to monitor and analyze key performance indicators: data and statistics, in real time or for a desired period, on documents and user connections to optimize collaboration, traceability and information accessibility.
-
In the , clck on to access performance indicators:
5.1. Workspace storage usage
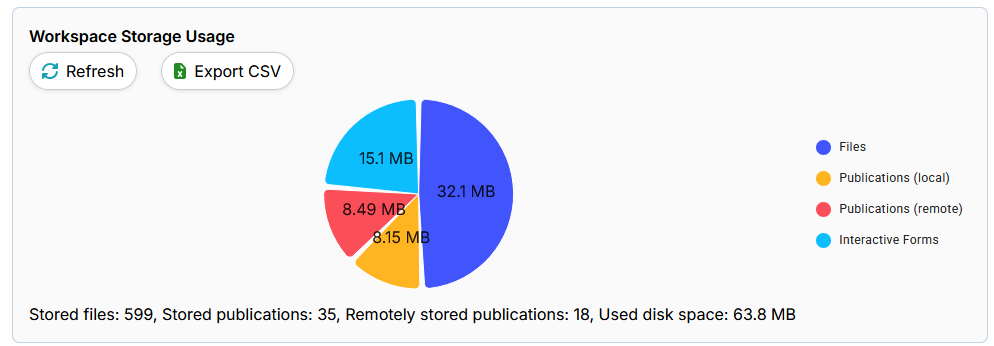
In “Workspace storage usage”, you can see how much disk space is being used, as well as the distribution of storage between files, publications (local and remote) and interactive forms.
5.1.1. Items displayed :
-
Stored files : Total number of files stored.
-
Stored publications: Number of publications stored locally.
-
Publications stored remotely: Publications hosted on an external server.
-
Disk space used: total size of data stored in the workspace.
5.1.2. Actions available :
-
Refresh: Updates the data displayed in the workspace storage in real time.
-
Export CSV: Uploads a summary file of information concerning the storage of files in the workspace in csv format.
5.1.3. Storage diagram
A pie chart illustrates the distribution of space used by :
-
Files:
-
Local publications
-
Remote publications
-
Interactive forms
Each category is represented by a distinct color for quick viewing.